Bar Charts Creating
New in 3.0
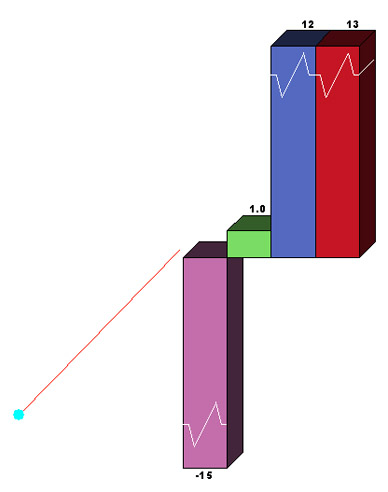
- Display charts in 3D
- set default values for: bar outline color and width , leader line color and width
New in 2.0
- create charts over "old" charts
- select bar chart symbol(s) by context menu
- remove labels for selected charts
New in 1.2
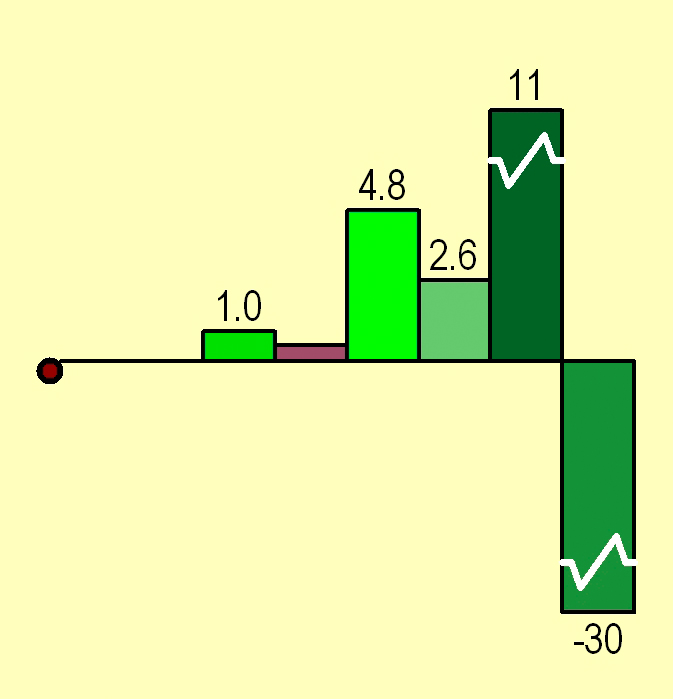
- Support negatives values
- Support NULL separately from "min-value"
- Directly draw barcharts markers. No problem with error "Too many fields" now.
- Unfortunately not support standard layer property dialog for additional customizing charts properties
The basic benefits
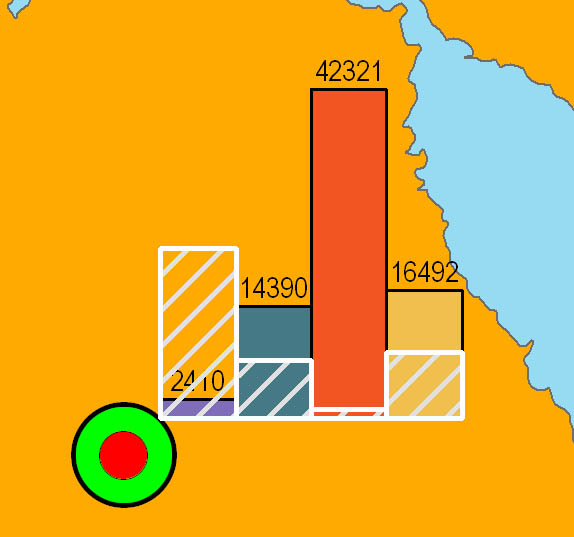
-
Creating
the charts which are not overlap a marker of a point theme.
-
Set
distance from a marker to chart
-
Labeling
the charts
-
Setting
of the minimal and maximal values
-
Updating
of charts on the old places
-
Saving
a legend and parameters of creation
-
Save/load
annotation layer to/from file. |
User guide
|
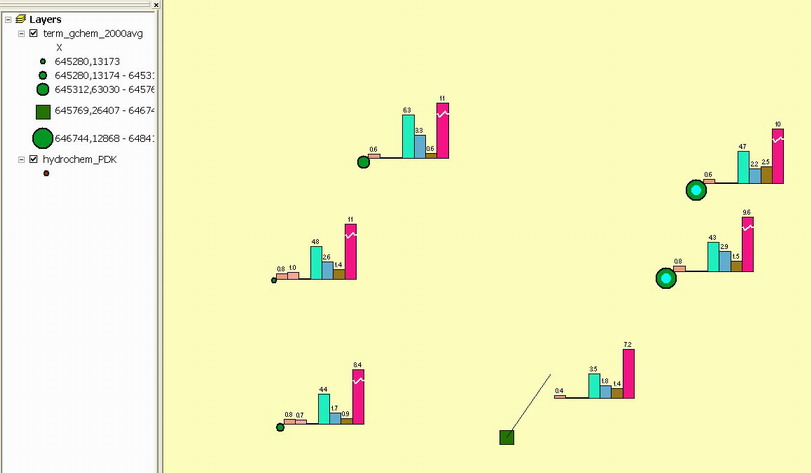
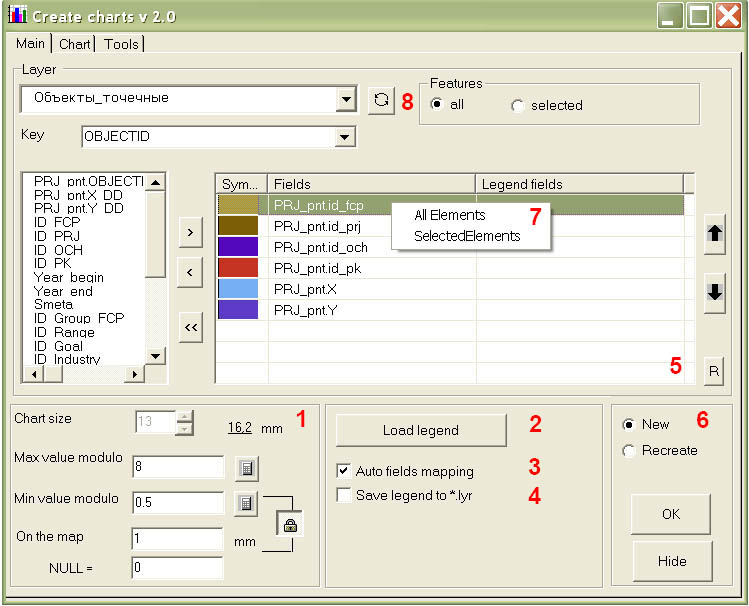
The
charts are created on the annotation layer with name <LayerName_charts>
for all or selected features OptionButtonĀ"New" ¢ delete annotation layer and create new charts. OptionButton
"Recreate" ¢ refresh old charts. ½Old charts╗ and ½New charts╗
are related on the Key-field, which was selected. The created
chart is a group of elements: chart, labels and break-line (if necessary).
There are data (the key, the names and values of the fields) associated
with chart element. |
|
1-
Calculating of min and max values
for selected fields. At the charts creating all values less then minValue
or NULL are rounded to MinValue, all values more than maxValue are rounded
to MaxValue and the break-line is drawing (zig-zag). Basic data in the
table are not changed. It is possible to set the height of the smallest
bar in millimeters in current map scale. (This value is related on maxValue,
chart size and map ReferenceScale). The minValue is changed. |
|
2-
Loading legend from *.lyr or *.leg
files. |
|
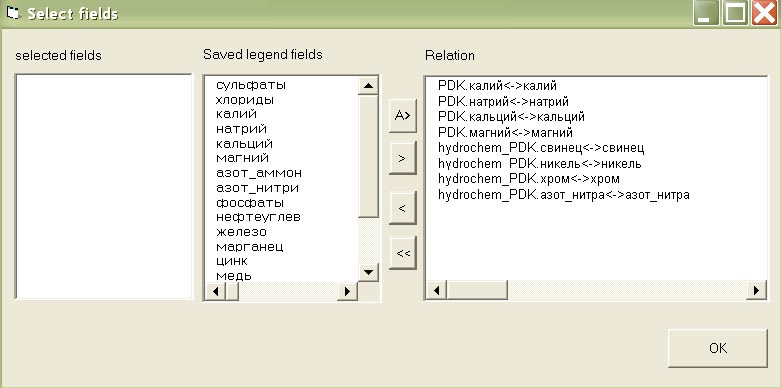
3-
When you load legend it is possible
to set relation between selected fields and legend fields. Auto mapping
is set relation for fields like CurrentLayer.Field1 Ķ Legend.Field1 |
|
4-
Save legend to *.lyr file after creating
the charts. |
|
5-
Random color |
|
6-
Hide form. If youÆve loaded new map,
close the program ([x ]-button on the upper right corner of the window) and start it again,
otherwise (layers was changed) select button refresh near ōLayersö combobox. |
|
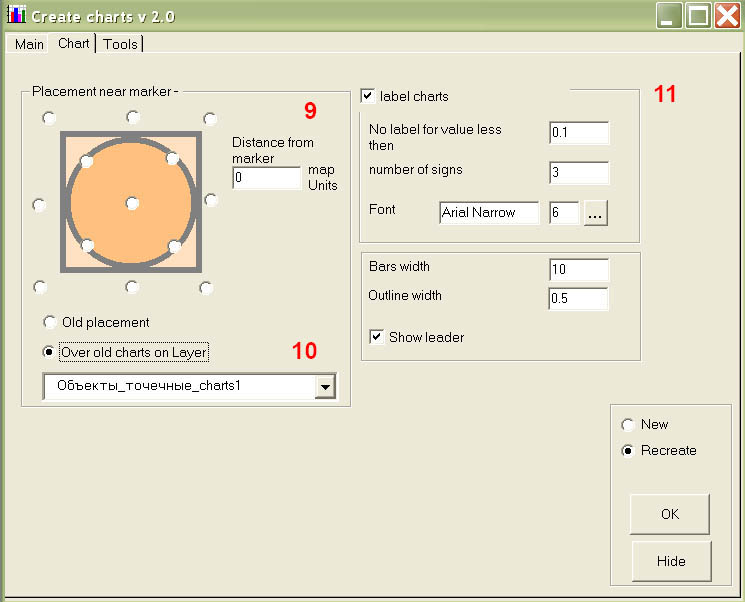
9-10
Chart
placement¢ side or corner for rectangle markers(or marker envelope)
, tangent ¢ for circle markers. Distance from the marker is in map units. |
|
11-
Label
and chart properties |
|
-
Do not
label bars with values less then selected |
|
-
Number
of signs in label. Example for n= 3: |
|
a.
0,158
¢> 0.2 |
|
b.
1.24
-> 1.2 |
|
c.
10.8
-> 11 |
|
d.
12558.89
-> 12559 |
|
-
Bar width,
Bar default outline width, chart size |
|
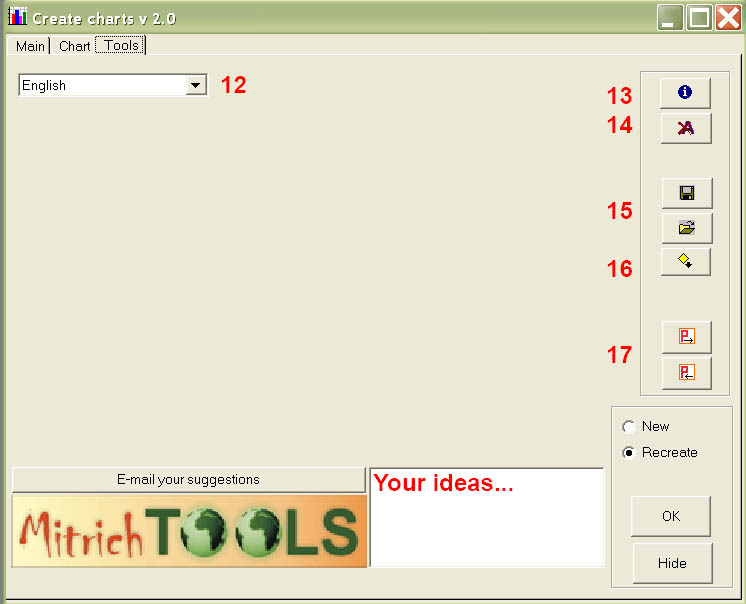
12-
Change
language |
|
13-
Identity
the chart element (key and fields values). Select charts on the map
and then press button. |
|
14-
Remove
labels |
|
16-
Save
legend to file (*.leg). Select ONLY ONE chart on the map and press button.
Load legend on the main page. It is useful if you forgot to save legend
to .lyr file. |
|
|
|
17-
Save/load
creation parameters (except legend) |
Feedback
Your ideas and comments will be
very much appreciated!
Mailto: mitrichtools@mail.ru